Address
304 North Cardinal St.
Dorchester Center, MA 02124
Work Hours
Monday to Friday: 7AM - 7PM
Weekend: 10AM - 5PM
Address
304 North Cardinal St.
Dorchester Center, MA 02124
Work Hours
Monday to Friday: 7AM - 7PM
Weekend: 10AM - 5PM
Measured industrial VOC destruction efficiency, thermal recovery data, and real project engineering results across automotive, chemical, and coating industries.
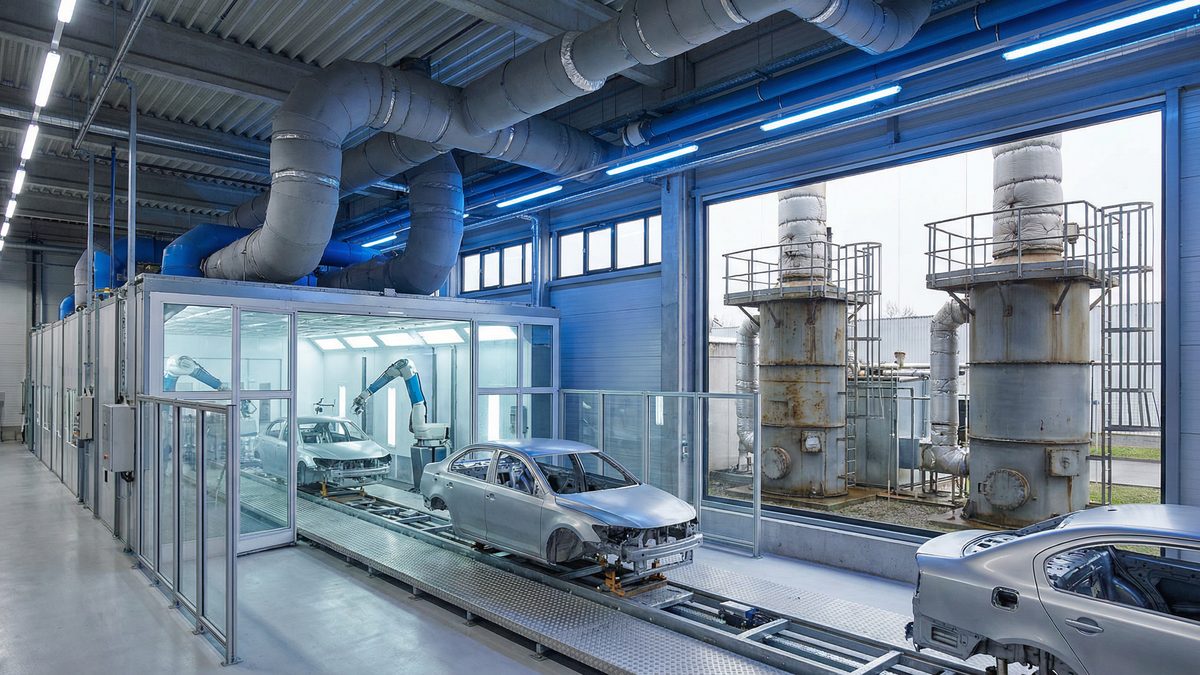
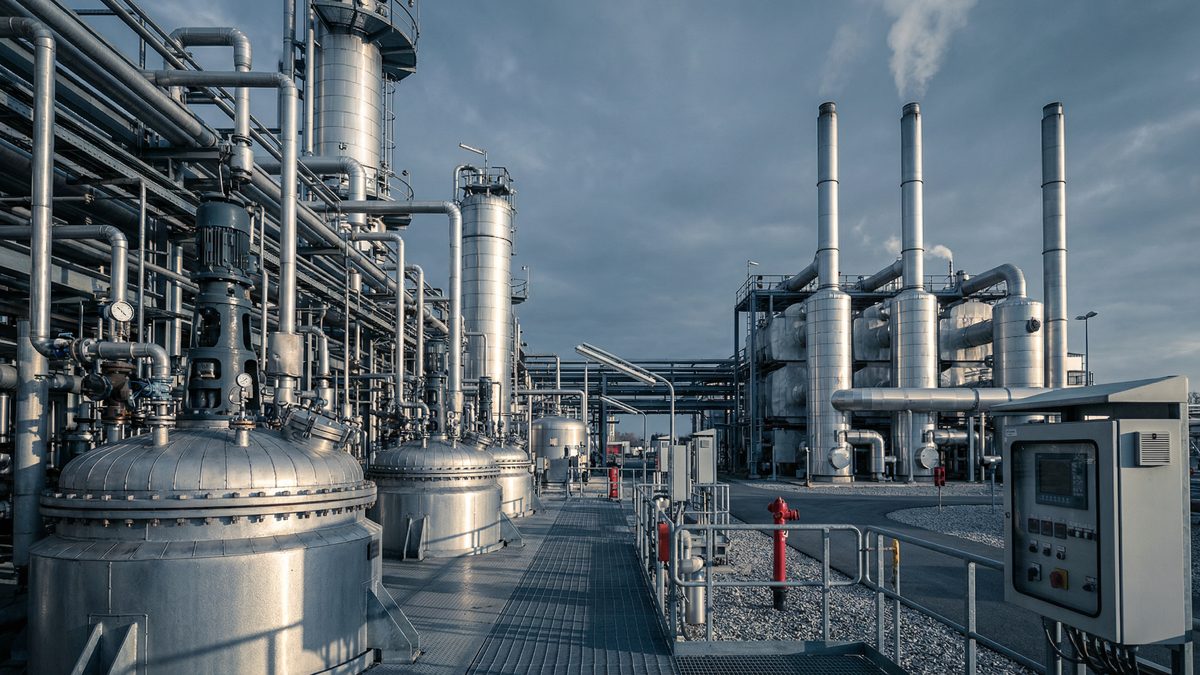
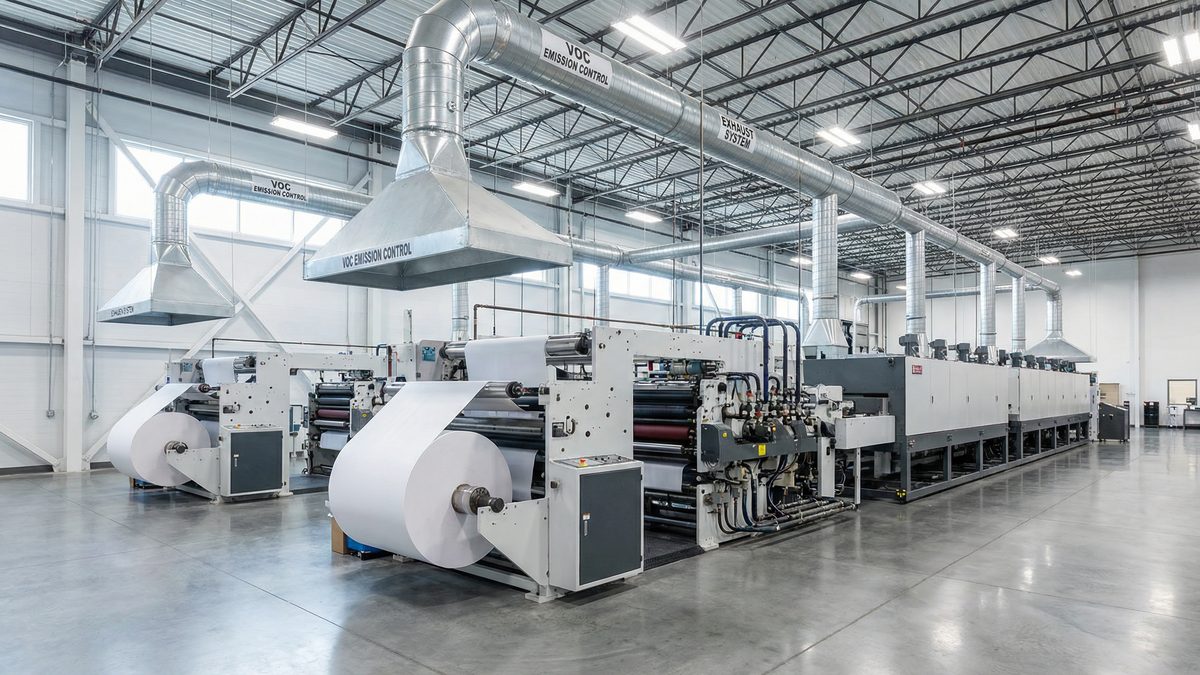
Regenerative Thermal Oxidizers (RTOs) are widely implemented for VOC emission control across industrial sectors such as coatings, printing, chemical processing, and automotive manufacturing. Demonstrating real-world performance and project data enhances confidence in system design, destruction efficiency, energy recovery, and compliance outcomes. This page presents performance benchmarks, measured results, and engineering case studies to support technical evaluation and project specification.
98–99.5%+
Measured DRE across automotive, chemical, and printing installations
80–95%
Ceramic heat exchange media recovering sensible heat from outgoing flue gas
<50 ppm
Post-oxidation emission concentration meeting regulatory compliance targets
24/7
Verified stable VOC load handling in continuous industrial operations
The following data represents measured results from multiple industrial deployments. Performance depends on VOC composition, inlet temperature, and airflow conditioning.
| Industry | VOC Inlet Load | Outlet VOC | DRE Achieved | Heat Recovery | Fuel Savings |
|---|---|---|---|---|---|
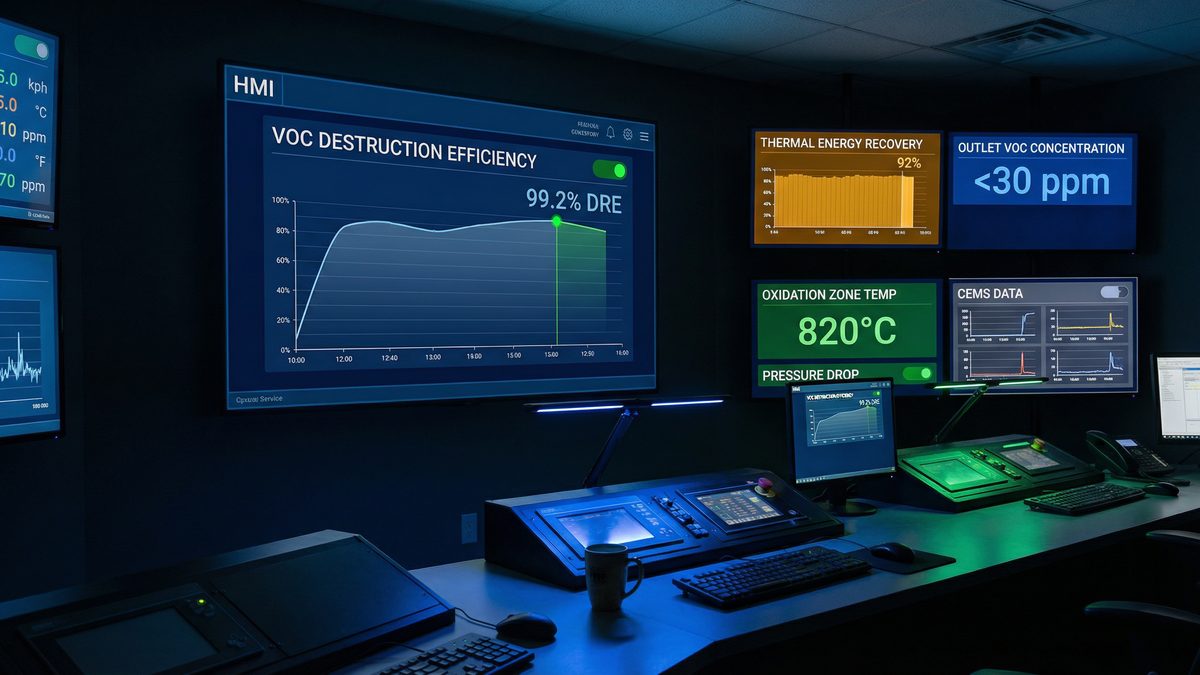
| Automotive Coating | 1–3 g/m³ | <30 ppm | 99.2% | 92% | 45% |
| Chemical Processing | Variable (BTEX) | <10 ppm | 99.5% | 90% | 50% |
| Printing Industry | 0.8–2 g/m³ | <50 ppm | 98.8% | 88% | 38% |
Data based on field measurements from installed systems. Results may vary depending on site-specific conditions, VOC composition, and airflow parameters.
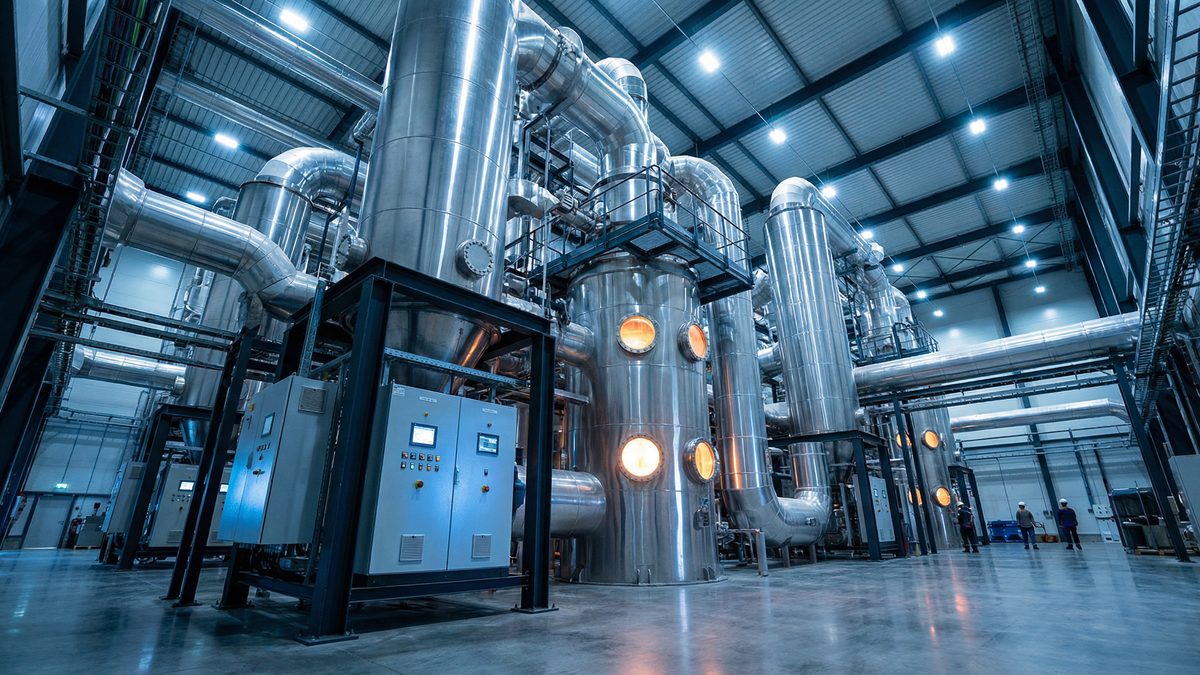
Engineering results from real industrial RTO deployments across three key application sectors.
VOC destruction removal efficiency (DRE) is a function of multiple interacting parameters. Case studies confirm that maintaining stable oxidation temperature and minimizing bypass improves VOC conversion across varying load conditions.
SCADA/HMI monitoring dashboard showing real-time RTO performance data including VOC DRE, thermal recovery, and CEMS output.
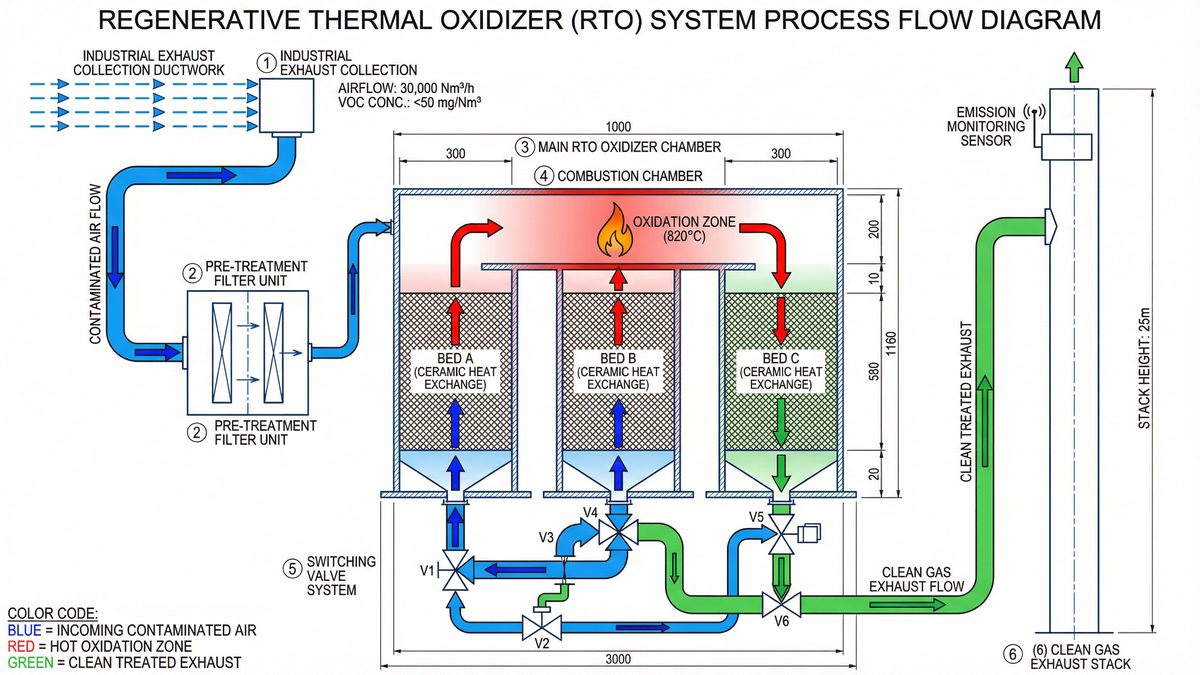
RTO system process flow diagram: exhaust collection → pre-treatment → ceramic bed heat exchange → thermal oxidation → clean gas discharge.
Performance verification is conducted through multiple measurement methods to confirm VOC emission compliance and operational efficiency across all installed systems.
CEMS provide ongoing VOC outlet data for regulatory compliance reporting and internal performance tracking. Data is logged continuously and available for audit purposes.
Periodic audits using EPA Method 25/25A or equivalent industrial standards confirm VOC destruction efficiency and validate CEMS calibration accuracy.
Fuel input versus recovered heat is measured across heat exchanger media to assess thermal efficiency and identify optimization opportunities for long-term operation.
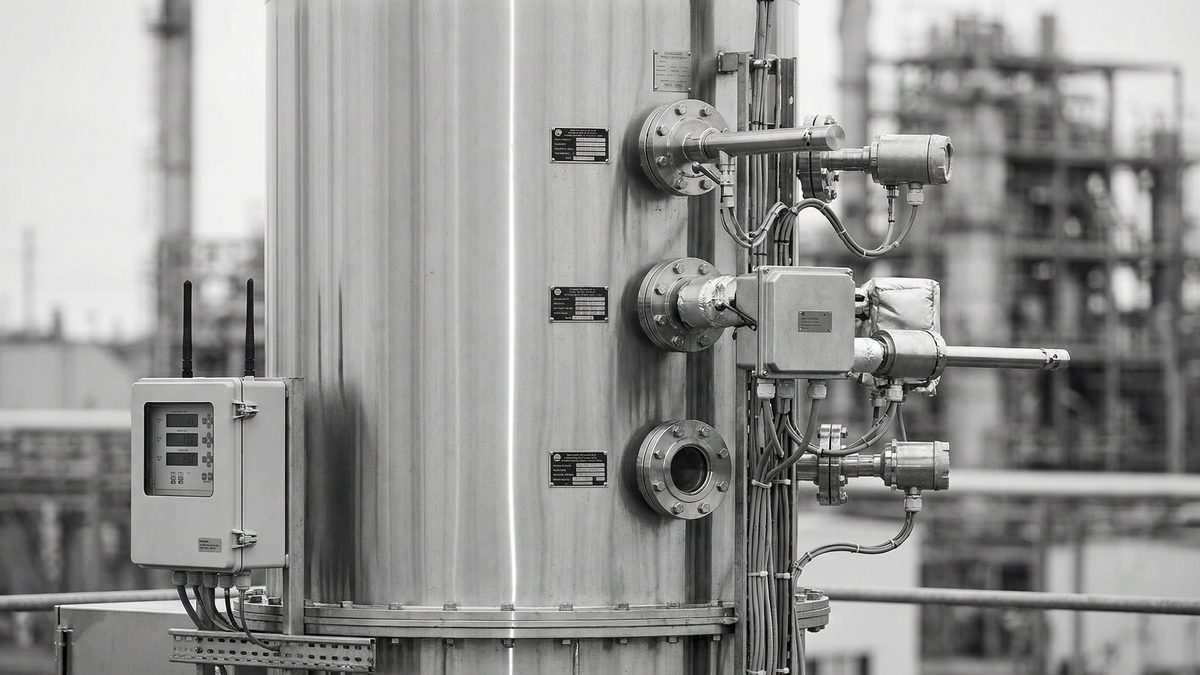
Emission Verification
Continuous Emission Monitoring Systems (CEMS) are installed directly on the exhaust stack to provide real-time VOC outlet concentration data. Sampling probes, analyzers, and data transmission equipment are mounted at designated monitoring ports.
Stack testing using EPA Method 25/25A provides periodic independent verification of VOC destruction efficiency, confirming that installed RTO systems consistently meet regulatory emission limits across varying operational loads.
Technical questions on RTO performance results, verification methods, and system efficiency.
Industrial RTO systems commonly achieve 98%–99.5%+ VOC destruction removal efficiency (DRE) depending on operating conditions. Automotive coating applications have demonstrated consistent DRE above 99.2%, while chemical processing installations have achieved outlet VOC concentrations below 10 ppm. Performance depends on VOC composition, inlet concentration, residence time, and oxidation temperature stability.
Performance verification uses three primary methods: Continuous Emission Monitoring Systems (CEMS) for ongoing outlet VOC data, periodic stack testing using EPA Method 25/25A or equivalent standards, and energy balance evaluation measuring fuel input versus recovered heat across ceramic heat exchanger media. These methods together confirm VOC destruction efficiency and regulatory compliance.
Thermal energy recovery efficiency is primarily driven by ceramic media heat capacity, bed switching frequency, and control logic optimization. High-capacity ceramic saddles or structured media retain more sensible heat between switching cycles. Multi-bed configurations with optimized switching intervals maximize heat capture. Case data confirms 80–95% thermal recovery across different industrial applications, with automotive installations achieving up to 92%.
Yes — VOC load fluctuations are common in coating, printing, and chemical processing operations. RTO systems are designed with automated control logic to maintain stable combustion chamber temperature across variable inlet conditions. Case studies from printing facilities demonstrate seamless load transition with DRE maintained above 98.8% even during airflow variation. Pre-treatment conditioning further stabilizes VOC inlet quality to protect system performance.
Yes — real project performance metrics directly inform new system design parameters. Measured pressure drop data refines ductwork sizing calculations. Verified DRE values validate combustion chamber residence time assumptions. Actual fuel consumption figures improve energy cost forecasts. Performance study outcomes also identify opportunities for ductwork re-sizing, enhanced control logic, and improved pre-treatment to optimize long-term VOC destruction efficiency.
Share your airflow rate, VOC concentration, and compliance requirements. Our engineering team will evaluate your project and provide performance-based system recommendations including detailed performance reports, customized VOC system design, and project cost and energy optimization.
Engineering response within 1–2 business days | Confidential project evaluation | No commitment required
Our engineering team will respond within 24 hours.